Visualizing gene expression across multiple tissues and individuals is a challenging task, even more so if you want to also consider the quality of the data or alignments. A recently published tool called 'QuickRNASeq' was developed to make summarizing expression data more manageable. With the kind assistance of the author of that tool, and some modifications of the code, we now have a set of expression tools that link to existing tools on this site, such as the genome browser.
The expression data presented here was generated by INRA from the XRQ genotype. In total, there is about 1 billion RNA-Seq reads from 10 tissues that was mapped to the HA412HO bronze reference. A basic overview of the steps in the analysis pipeline are presented below.
Expression pipeline:
- Quality trimming with Trimmomatic
- Alignment of trimmed reads with STAR
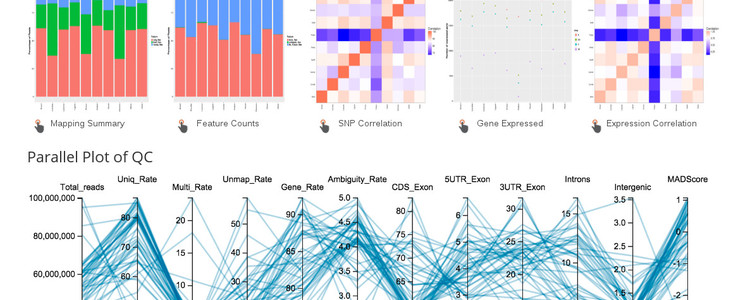
- Alignment counts are tabulated with featureCounts from TopHat.
- QC metrics are summarized with the RSeQC package
- SNP calling is done with samtools on the BAM files from STAR
- Custom scripts are used to generate the annotation tables for each tissue
It should be noted that quality trimming RNA-Seq data is subjective and it may actually lower the mapping rates. In our case, the data were from an earlier generation Illumina instrument and the quality was very low so we performed some conservative quality trimming prior to alignment.
The alignment, counting, QC summary, and SNP calling steps were implemented in a slightly modified version of QuickRNASeq which we can make available if that is of interest.
A description of how to use the expression tools for your analysis will be the subject of a separate, more detailed post in a different section of the site.