The gene expression tools available on this site will allow you to 1) see overall mapping quality of RNASeq data to the sunflower genome, 2) explore expression by tissue and gene feature, 3) and compare expression of individual genes in 10 different tissues.
There are three main sections that the data is divided into. In order (from the top of the page), there is 1) the QC Metrics, 2) the Parallel Plot of QC, and 3) the Expression Table. For research purposes, the latter two sections, shown in the screenshot below, will be of most interest.
Parallel Plot of QC
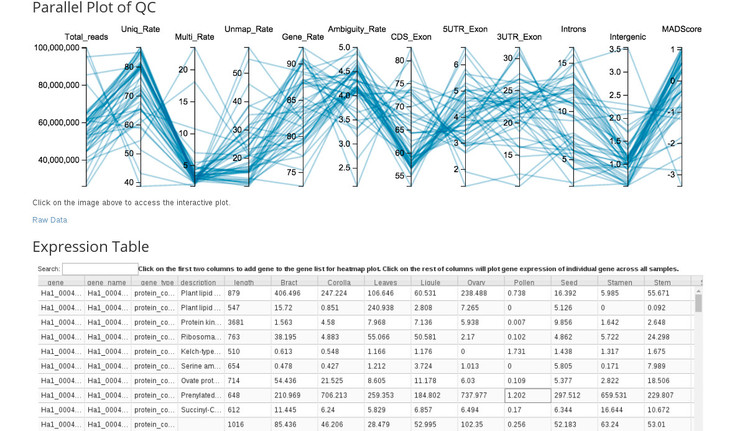
If we click on the image under the "Parallel Plot of QC" section we are taken to an application for exploring gene expression by tissue (shown below).
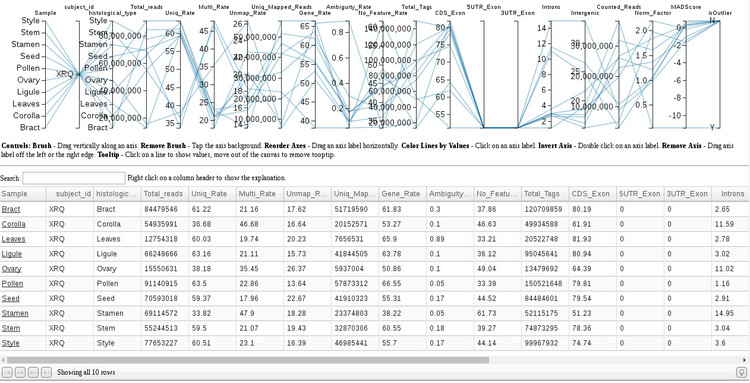
There are several utilities provided in this application. As a convenience, we can filter the list of tissues to explore by typing in the search box. With the cursor, you can hover a row and see the expression statistics highlighted in the plot above. Clicking on the tissue name in the first column with open a new window with a comprehensive report on mapping, splicing, and expression statistics for that tissue.
Expression Table
If we click on the expression table image a new application will open which shows expression on a gene-by-gene basis, whereas the Parallel Plot of QC tool shows expression by tissue. Shown below is what you will see when the Expression Table opens.
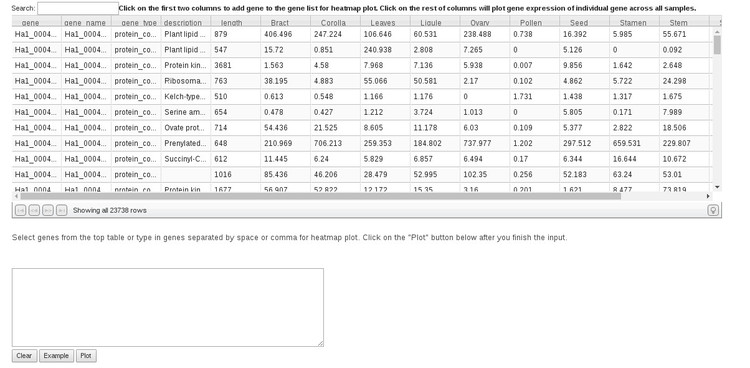
If there is a specific gene you are interested in, the way to find that would be to start typing the gene ID in the search box above the table. The gene list should be filtered as you type. To see a plot of expression for that gene in each tissue (shown to the left in the plot below), simply click anywhere in that row under any of the tissue type columns. To compare expression of multiple genes, either click the gene ID in the first column to add them to the list, or paste in a list of IDs in the search box below the table. Then, click "Plot." You an click the "Example" button to see how this works. This will generate a list of genes to plot and clicking "Plot" will generate the plot to the right in the image below.
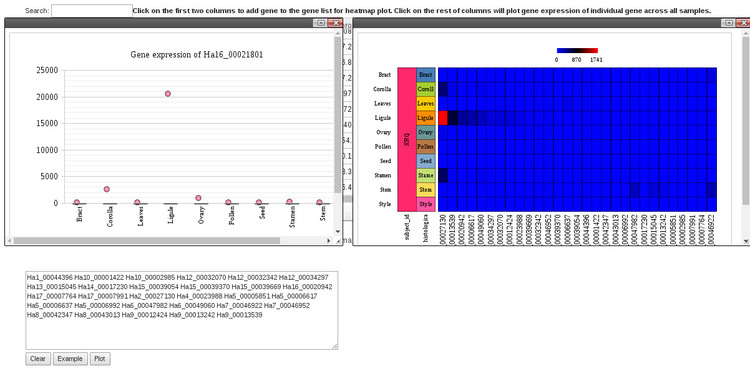
There are controls in the plot windows which will allow you to take a screenshot or save the plot as an image.
Finally, it may be of interest to explore gene expression by tissue without downloading the raw data. It is possible to sort the table by any column, for example, gene description or expression value, by clicking on the column headings.